Getting Started
This page assumes you've completed Installation. It walks through the whole toolchain hands-on: a simple test program, building both models, running the simulator against it, observing the resulting trace in the log viewer, running the full validation suite, and debugging with gdb.
SPARC V8
SPARC V8 is the 32-bit RISC instruction set architecture this project models, standardized as ANSI/IEEE Std 1754-1994. See SPARC V8 Architecture for what makes it distinctive and a page-indexed guide to the authoritative manual, bundled in this repository.
A simple program
Let's consider a simple assembly-level program: put two numbers in
registers, and add them. It's already present at
validation/test_simple_ADD/test_simple_ADD.s:
! test_simple_ADD.s
!
! The simplest possible SPARC V8 test program: add two numbers and put
! the result in a register, then halt.

.global main
main:
_start:
    ! Disable traps. %g0 always reads as 0, so this writes 0 into
    ! every bit of %psr, including ET (trap-enable). A write to %psr
    ! takes a couple of cycles to take effect, hence the nops after it.
    wr %g0, %psr
    nop
    nop
    nop

    ! The actual computation: %o0 = 5 + 7
    mov 5, %l0      ! move 5 into register l0
    mov 7, %l1      ! move 7 into register l1
    add %l0, %l1, %o0   ! o0 = l0 + l1 = 0xc (12)

    ! Halt. Traps are disabled (ET=0, set above), so this `ta 0`
    ! is not taken as a trap: it forces the processor straight into
    ! error_mode instead, which every model in this repo recognizes as
    ! a deliberate, successful stop (not a bug).
    ta 0
    nop
    nop
The first step after writing a program like this is to convert it into
machine code and load it into the simulated processor's memory. A memory
image is already present too, at
validation/test_simple_ADD/test_simple_ADD.hex, along with its
disassembly at validation/test_simple_ADD/test_simple_ADD.objdump.
We'll point the simulator straight at the .hex file.
Later, to modify this test or write your own, you'll need to compile it
into a memory image (.hex) yourself. See
Writing and Running Assembly Programs
or Writing and Running C Programs.
Building the SPARC models
The models under model/ are available in several configurations, each
in its own folder under model/system_models/ (core_only, core_mmu,
and more, see Configurations). Each
configuration's folder contains two testbenches, cpp_model/ and
sitar_model/ (see Models), each with its own
build.sh. A build's resulting executable is written into that
testbench's own executable/ subfolder.
To build a particular configuration, say core_only, from the repo
root:
The first produces the plain, fast executable
(executable/sparc_sim_cpp_core_only), used by run_simple_test.sh
below and by the validation suite. The second, in addition, produces a
_logging-suffixed executable
(executable/sparc_sim_cpp_core_only_logging) that writes an
instruction trace when run, used in "Observing the simulation log"
below. Logging defaults to off (see "Build options" below), so
building it explicitly is the only way to get a trace.
Build the Sitar-timed model the same way, from the repo root:
In comparison to the C++ model, the Sitar model drives the exact same core through Sitar instead of the plain functional loop, adding real per-opcode, interconnect, and memory timing.
Build options
Both build scripts take the same options:
--logging/--no-logging(default: off)
Whether the model writes an instruction trace when run, see "Observing the simulation log" below.--debug/--debug-o0/--no-debug(default: off)
Whether to build with debug symbols, for examining a running model with gdb, see Examining Core State at Runtime Using GDB.
Build each of the other configurations the same way, substituting its own folder:
cd model/system_models/core_mmu/cpp_model
./build.sh
./build.sh --logging

cd model/system_models/core_mmu/sitar_model
./build.sh
./build.sh --logging
core_mmu_devices and core_l1cache_mmu_devices are planned
configurations, not yet buildable, see Model
Configurations.
Running the simulator
The process is: first build a configuration (previous section), then run its simulator executable, pointing it at a hex file. A hex file is a memory image, the machine code for the program to run on the simulator.
To run the C++ model against a memory image, from the repo root:
cd model/system_models/core_only/cpp_model
./executable/sparc_sim_cpp_core_only ../../../../validation/test_simple_ADD/test_simple_ADD.hex
Similarly, for the Sitar-timed model, from the repo root:
cd model/system_models/core_only/sitar_model
./executable/sparc_sim_sitar_core_only ../../../../validation/test_simple_ADD/test_simple_ADD.hex
The simulation executable expects the following arguments:
hex_file(required)
The memory image to run.expected_results_file(optional)
A file listing the expected final register values, see Format for the expected-results file for its format. If given, once the program halts, the final processor state is checked against it and the executable prints a PASS/FAIL verdict per check plus an OVERALL result, instead of the detailed state.max_cycles(optional)
Caps how long the simulator runs before giving up, in case the program never halts (a bug, or a genuine infinite loop). Defaults to 1 million cycles. Pass a smaller number to fail fast on a quick test, or a larger one for a program that legitimately needs more cycles than that to finish.--stats(optional, can appear anywhere among the arguments)
Prints the model's own performance measures (core statistics, and, where present, MMU and physical-memory statistics) once the run finishes. Off by default. See Performance Modeling.
For example, checking the same run against its expected-results file,
with --stats added, back in model/system_models/core_only/cpp_model:
./executable/sparc_sim_cpp_core_only \
    ../../../../validation/test_simple_ADD/test_simple_ADD.hex \
    ../../../../validation/test_simple_ADD/test_simple_ADD.expected \
    1000 --stats
Core statistics:
  Instructions fetched             = 8
  Loads                            = 0
  ... (more counters, all 0 for this simple test)

PASS: o0 = 0xc
PASS: l0 = 0x5
PASS: l1 = 0x7
OVERALL: PASS (3 checks)
Running the existing simple test
The same check has a shortcut, run_simple_test.sh, bundled in every
testbench folder. cd to the same level as the build script (the
testbench folder, e.g. model/system_models/core_only/cpp_model) and
run it directly:
A fixed, minimal wrapper around the same hex-file-plus-expected-results
check above, with --stats always on. Always against the plain,
non-logging build, so it doesn't produce a .log file itself. For a
simulation log of this same
run, see "Observing the simulation log" below, which runs the
_logging executable directly against the same hex file instead.
Observing the simulation log
Run the _logging executable built earlier (see "Building the SPARC
models" above), still in model/system_models/core_only/cpp_model:
./executable/sparc_sim_cpp_core_only_logging \
    ../../../../validation/test_simple_ADD/test_simple_ADD.hex
A --logging build gets its own executable name (with a _logging
suffix), so it coexists in executable/ alongside the plain default
build from the section above, rather than replacing it. Running it
produces a .log file in the current directory, containing a detailed
simulation trace showing the processor state at the end of each
instruction cycle.
The generated log file has the same name as the .hex file, but with a
.log extension. Although it's a plain text file in tab-separated value
(tsv) format, and can be viewed in any editor, this project provides a
graphical trace visualizer to step through the execution and watch the
processor state evolve.
Try the trace viewer here
log viewer, preloaded with the trace for the test_simple_ADD example.
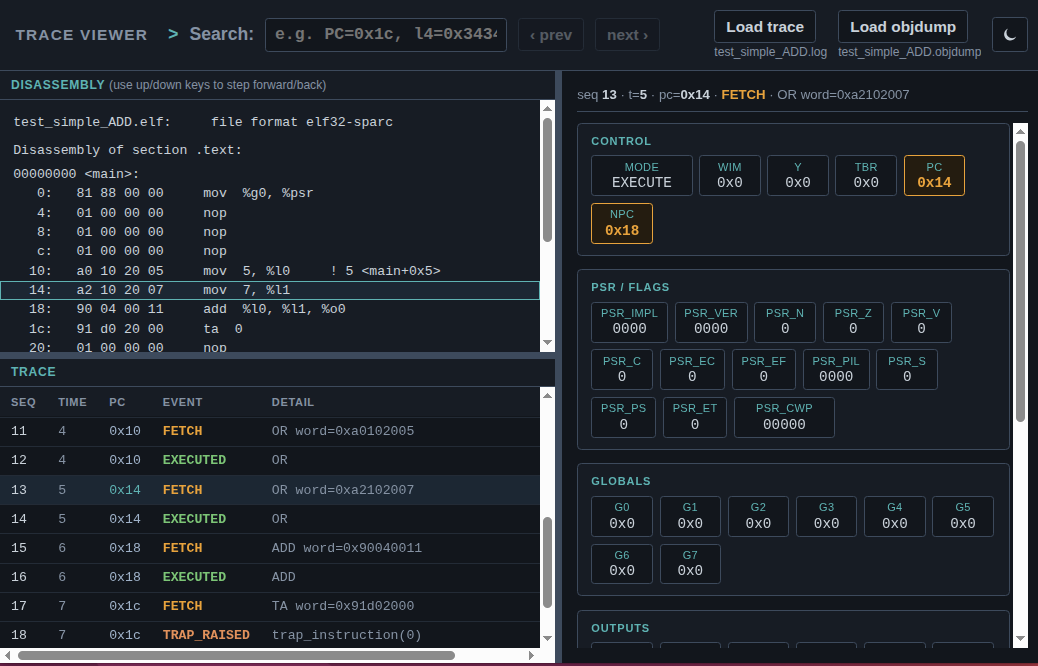
The viewer allows the user to simultaneously view:
- the simulation event trace (
.log) - the assembly code being run (
.objdump) - and the processor state at the end of each traced event, showing the register values.
Using the viewer
- Clicking on a line in the trace automatically highlights the
corresponding line in the disassembly and shows the processor state
for that event. The
upanddownarrow keys can be used to step forwards and backwards through the execution trace. - Register values that change at each step are highlighted.
- A search bar at the top lets you search for a specific PC or register
value in the event trace and jump to it. The
NextandPrevbuttons step through multiple matches.
Each row in the generated log records a sequence number, time, PC, event type, an event-specific detail, and the full processor state. The event types are:
RESETthenTRAP_ENTER
At the very start of every run. The model always boots by taking an implicit reset trap into the first instruction. You didn't write this, it's automatic.FETCHthenEXECUTED, one pair per instruction
FETCHshows the opcode about to run, with the current-window register state still as it was before this instruction.EXECUTED(the very next row, same PC) shows that state after, with whatever changed highlighted. Watch%l0/%l1/%o0fill in, on theEXECUTEDrow of eachmov/mov/addpair, as the sequence runs.TRAP_RAISEDthenHALT
At the end. The finalta 0is executed with traps already disabled (that's what thewr %g0, %psrat the top did), so it has no handler to jump to. The processor forces itself intoerror_modeinstead. This is this project's halt convention, used by every test program in the repository. It's what the executable'sPROCESSOR STATE: ERRORandSimulation halted after N cycles.output means, and it's expected, not a bug.
To view a different log file, open log_viewer/viewer.html directly in
a browser, then click Load trace to pick the log file and
Load objdump to pick its matching disassembly file.
Viewing memory state
The generated log and viewer don't currently track memory state, even though the trace may contain load/store event details.
For examining or probing memory state during execution, see Examining Core State at Runtime Using GDB.
Running a validation suite
This project includes a large, well-curated suite of tests for
functional validation of the models. Each test is a small program
(assembly or C) paired with a description of its expected result. The
tests, and the scripts to run them, are included in validation/.
The suite contains:
- Assembly tests
Theasm/folder contains several hundred assembly tests, organized into instruction-type clusters, each targeting one instruction (or a small family of closely related ones). - C tests
TheC/folder contains self-checking C programs, each computing some integer or floating-point operation and comparing the result against a known value. - A test runner
validation/run_tests.pyruns them all and reports a pass/fail summary.
It's worth running whenever you change the model itself, to check
nothing broke. validation/run_tests.py drives each model's plain
default build (no --logging, no --debug), the one already built in
"Building the SPARC models" above. Some tests run long, and logging
isn't needed here. Rebuild it if you've made changes since:
Then run validation/run_tests.py, pointing it at a folder of tests.
Example, a small subset first:
[PASS] validation/asm/misc/save_restore/SAVE.vprj
[PASS] validation/asm/misc/stbar_unimp_nop_sethi/STBAR_UNIMP_NOP_SETHI.vprj

<passed>/<total> tests passed
Point it at validation itself to run the entire suite instead of one
folder:
The script runs against core_only by default. Pass --config
core_mmu to run it against another configuration instead. It also
runs the C++ model by default. Pass --sitar to run the Sitar model
instead. Add -v to show every check's result, not just failures:
See Validation Suite for what's in a test, the full list of options, and how to add a new test to the suite.
Debugging
Logging suits a small test program well, but a long-running one can produce a log file too large to comfortably read through. Even with logging selectively turned on and off, the exact condition or bug you're chasing can be hard to pin down or trace this way. This is where a debugger becomes useful: it lets you surgically track a specific change, or inspect state at a specific point or condition at runtime, without printing large volumes of log output.
GNU's gdb, the standard debugger, is enough for this. Both models are,
underneath everything else, plain host C++ programs, so gdb attaches
to them directly, no cross-debugger or special protocol needed. Using it
well does still need some familiarity with the model's own source, to
know which variables hold the simulated architectural state.
Build with --debug first:
model/system_models/core_only/cpp_model/build.sh --debug
model/system_models/core_only/sitar_model/build.sh --debug
To make this convenient, debug/sparc.gdb provides a large set of
shortcut commands. For example, setting a breakpoint at a specific PC, a
watchpoint on a memory location, or printing one register:
See Examining Core State at Runtime Using GDB for the full command reference and a complete walkthrough.
What's next
Write your own test program: Writing and Running Assembly Programs or Writing and Running C Programs.