Logging
Logging plays an important role in working with this model. It's how you watch a program execute instruction by instruction (see Getting Started), confirm a timing change actually took effect (see Performance Modeling), or work out why a test is failing without single-stepping a debugger. This page covers how logging is actually put together across both models, how to narrow it down to just the part of a run you care about, and how to explore the resulting trace in the bundled log viewer.
The current scheme
SparcCore owns a CoreLogger (SparcCore::logger). There is one per
core instance, not per driver. Both cpp_model and sitar_model drive
the same SparcCore, so both produce the identical trace format from
it, one tab-separated row per architectural event (fetch, trap, memory
access) with the entire current-window state. This is viewable the same
way in the log viewer, regardless of which model produced it. See
"The log viewer" below and model/cpp_common_code/CoreLogger.h.
A driver uses CoreLogger one of two ways.
do_print=true(cpp_model/src/sparc_sim.cpp)
CoreLoggerwrites each row directly to a givenostreamitself.do_print=false(sitar_model)
Eachlog_*()call just returns the formatted row. The caller (SparcThread.sitar) forwards it into Sitar's ownlog<<mechanism instead of writing it directly.
That second path is where Sitar's own per-module logging comes in. Every
Sitar module or procedure owns a sitar::logger, unrelated to
CoreLogger. This is Sitar's own class, see
Sitar's Logging documentation
for the full mechanism. It can be pointed at:
- A common stream
Sitar's own default.setHierarchicalOstream(TOP, stream)(seesparc_sim.cpp) points every module or procedure's logger at the sameostream, so everything ends up interleaved together in one place. - A per-module stream
Points just one procedure's.logat its own dedicatedostream. This is whatsparc_sim.cppdoes forsparcThreadspecifically.sparcThread.log.setOstream(&sparcTraceFile), plususeDefaultPrefix=falseandsetPrefix("")to drop Sitar's own(time)hierarchicalId:prefix, givessparcThread's own trace: pureCoreLoggerrows, nothing else, a clean file completely separate frommainMemoryand theVirtualMainMemoryInterfaceinstances' own messages (sitar.log). Seemodel/system_models/core_only/sitar_model/README.md.
Both models name that trace file after the hex file's own basename, with
the trailing .hex replaced by .log (test_simple_ADD.hex produces
test_simple_ADD.log, written into the current directory). Running a
different test right after doesn't clobber the previous one's trace, the
way a single fixed filename would.
Compile-time on/off
Two macros are tied to the same --logging flag. Every configuration's
cpp_model/build.sh and sitar_model/build.sh both expose it (the
latter forwarding to the shared build_scripts/build_sitar_model.py).
--logging passes --cflags=-DSPARC_LOGGING_ENABLED through to sitar
compile alongside Sitar's own --logging, so one flag controls both.
SPARC_LOGGING_ENABLED
GatesCoreLogger. Without it (the default), everylog_*()method compiles down to a trivialreturn "";stub. None of the state-collection or formatting code exists in the binary at all, not just skipped at runtime. SeeCoreLogger.h's file comment.SITAR_ENABLE_LOGGING
Gates Sitar's ownsitar::loggerclass the same way (seesitar_logger.hin the separatesitarrepo).
This is why logging is a rebuild, not a runtime flag. Formatting the
entire current-window state (~50 fields) on every single instruction is
real, non-negligible cost, and a --no-logging build pays literally none
of it.
Selective on/off at runtime
Even within a --logging build, you don't have to log everything.
Sitar's sitar::logger has runtime turnON()/turnOFF()/isON()
methods, checked on every log<< call. They're cheap to toggle as often
as you like (see Sitar's own Logging documentation, linked above, for the
full mechanism).
A commented-out example of this lives in Core.sitar: a fourth branch in the
top-level parallel block, alongside sparcThread, mainMemory, and the
halt-detection monitor, that turns sparcThread.log on and off each
cycle based on both simulated time and PC. Copy it out and adjust the two
conditions to your own needs:
||
    do
        wait until (this_phase==0);
        $
        bool inTimeWindow = current_time.cycle() >= 1000 && current_time.cycle() < 2000;
        bool inPCRange    = sparcThread.core.reg.R_PC() >= 0x2000 && sparcThread.core.reg.R_PC() < 0x2100;
        if (inTimeWindow && inPCRange)
            sparcThread.log.turnON();
        else
            sparcThread.log.turnOFF();
        $;
        wait(1,0);
    while (1) end do;
Don't drop the wait(1,0)
It matters more than it looks. Without it, this loop never lets
simulated time actually advance. wait until (cond) returns
immediately once cond is already true, which it still is on the
very next iteration, with nothing else in the loop to change that.
So it spins at the same simulated instant forever, and hits Sitar's
iteration-limit safety net almost immediately. One cycle is plenty,
this only needs to re-check once per cycle.
Since this toggles sparcThread.log itself, it narrows the trace file
down directly. Rows outside the window or range are simply never
written, not filtered out afterward, turning a long run's trace into
something small and targeted enough to load into the log viewer right
away.
The condition above still has to be decided in advance and built into
Core.sitar. For a condition that depends on the program's own data at
runtime, a register or memory location reaching a specific value, see
Examining Core State at Runtime Using GDB
instead.
The log viewer
A single, self-contained HTML file, log_viewer/viewer.html, explores a
trace. It needs no build step and no server, and works entirely offline.
Open it directly in any browser.
It has three independently resizable panels.
- Disassembly
The.objdumpof the program under test, so you can see the actual instructions alongside their addresses. - Trace
One row per architectural event (FETCH,EXECUTED,TRAP_RAISED,MEM_READ, and so on), color coded by event type. - State
The full processor state at whichever row is currently selected: control fields (PC, nPC, WIM, Y, TBR), PSR flags, and all four register groups (globals, outputs, locals, inputs).
Click a row in Trace to select it and see its state there. Click a line
in Disassembly to jump to the first Trace row at that address. Use the
Up/Down arrow keys to step through the trace row by row, regardless of
any search. The search box (field=value, for example PC=0x1c or
l4=0x3434) filters to matching rows, prev/next step through them.
Try the log viewer here,
preloaded with a small sample trace (from the bundled test_simple_ADD
example) so you can explore it right away, no build required.
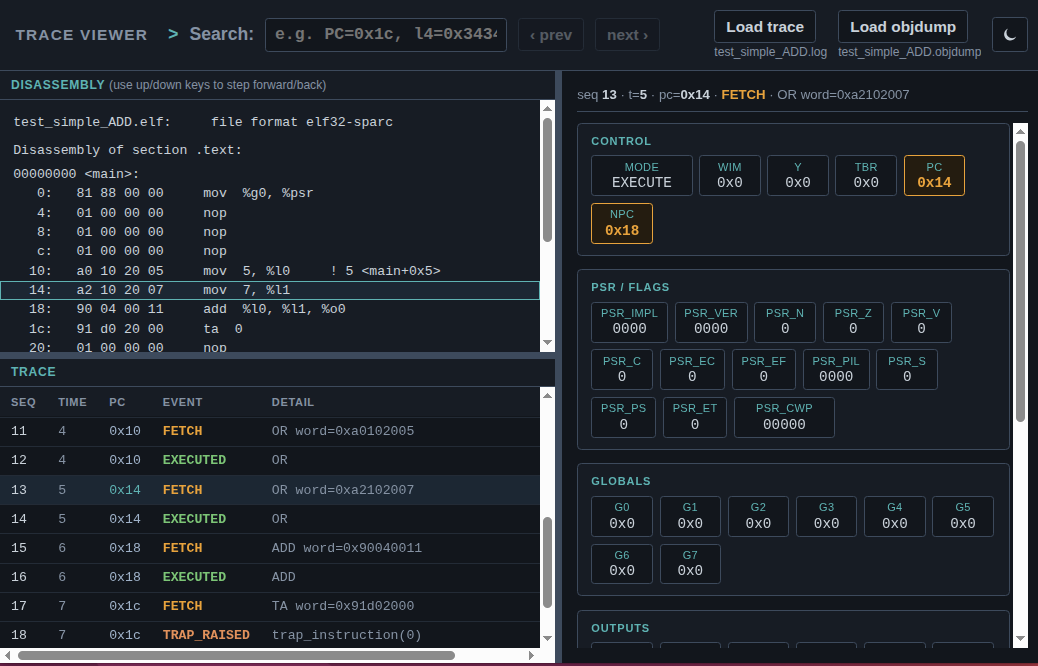
To view a trace of your own, open log_viewer/viewer.html from your own
clone instead, and use its Load trace/Load objdump buttons (top
right) to pick a trace file you produced yourself (see "Compile-time
on/off" above) and its matching .objdump. See
log_viewer/README.md for the full reference, including how to serve it
locally so a fresh trace auto-loads from a URL, the same way the embedded
copy above does.